Broadband Access Now an Integral Part of Community Well-Being
Broadband Access Now an Integral Part of Community Well-Being

We're on a mission to measure what matters to community well-being. Use our data to make positive changes where we live, work, and play. Together, we will help more people live better, longer.
2022 state rankings report released September 12, 2023-- Learn more
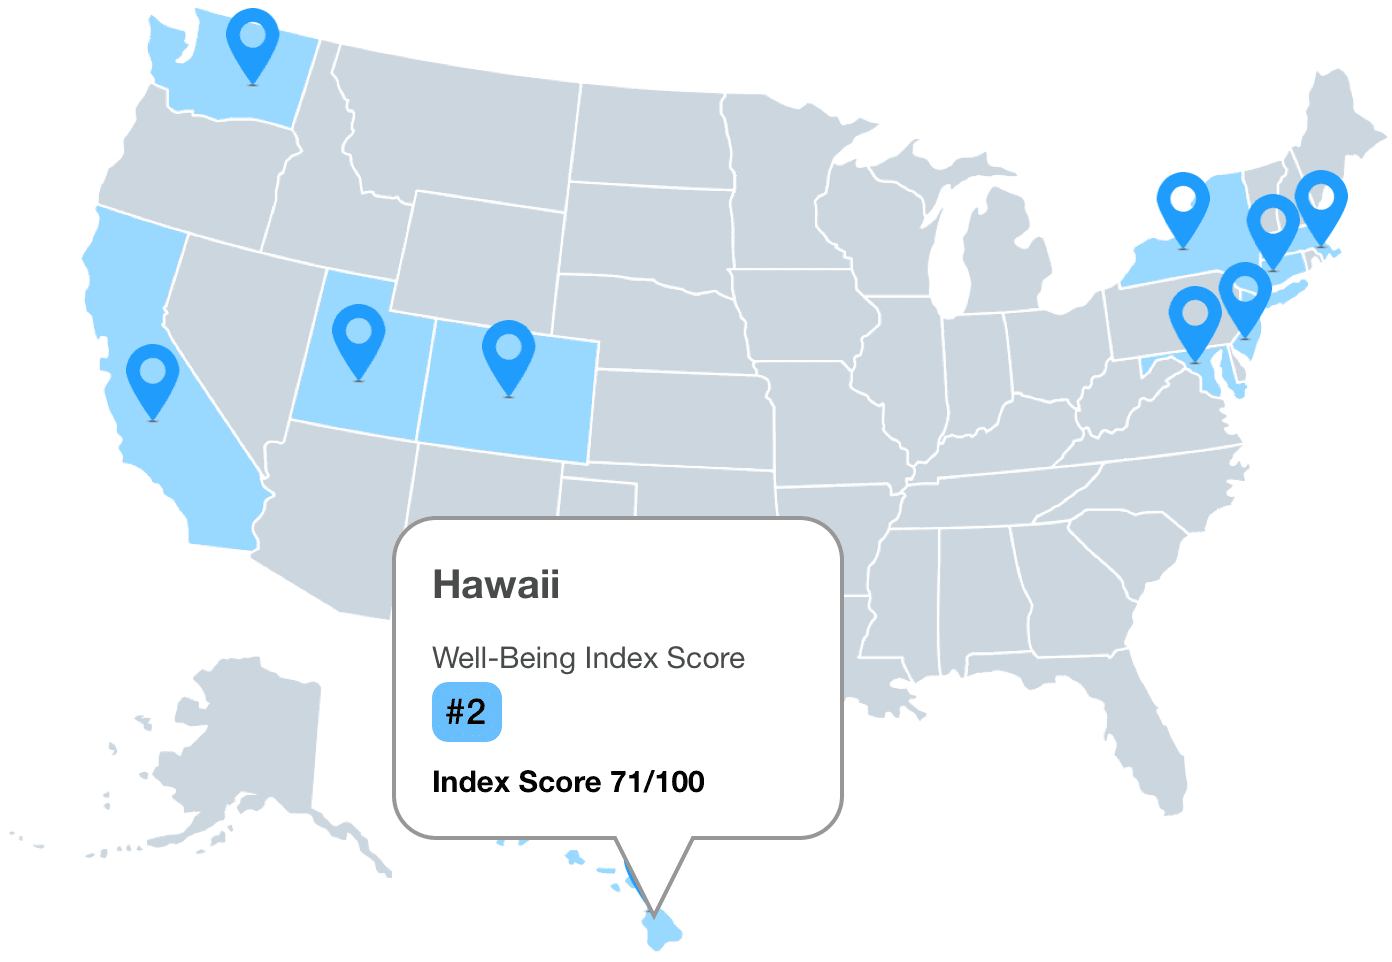
Our interactive map gives you powerful perspective on our data. Go broad, such as comparing your state to others. Or go deep, such as isolating the well-being concerns in your community. And that's only the start.
Our index brings together more than 600 proven health risk factors into a single measure. By combining both individual and social factors, our index uniquely measures well-being across people and places.
We based the index on decades of clinical research, health care leadership, and health economics. We conduct regular surveys within every community in the United States. We then analyze that data and score each community on a scale of 0 to 100. Updated every year, our current index is based on responses from more than 5 million surveys and 600+ social determinants of health.
Having good health and enough energy to get things done daily

Managing your economic life to increase financial security and reduce stress

Having supportive relationships and love in your life

Liking where you live and having pride in your community

Liking what you do each day and being motivated to achieve your goals


A layered approach to understanding the context of a community. Rather than focus only on the result, we can identify the root cause. And that insight sparks real change.
Including both individual risk and social determinant risk for the places your employees live and work
Democratize the information found, ensuring your employee population and community understand their SDOH circumstances
Integrate into benefits configuration, health equity considerations, worksite & built environment, community
Including how our efforts are augmenting well-being for your employees as well as the community broadly

See our index make an impact on community well-being.
Delve into details for your industry or role.